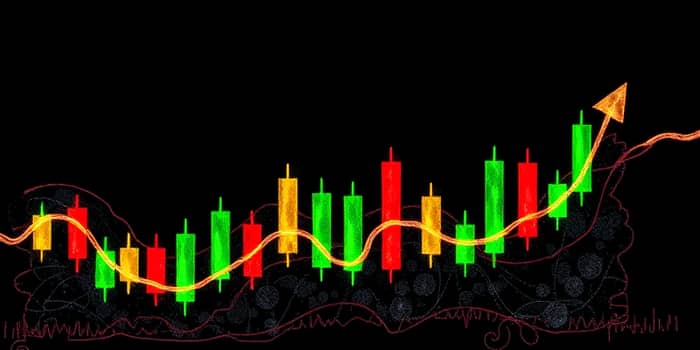
Candlestick patterns offer traders a window into market psychology, blending art and data to illuminate price movements.
For centuries, Japanese rice merchants harnessed visual charts to track supply and demand, laying the groundwork for modern candlestick analysis. Today, these patterns have become a foundation of technical analysis across stocks, forex, commodities, and cryptocurrencies.
By interpreting shapes and colors, traders can anticipate market turns, capitalizing on momentum shifts and reversals. Whether you’re a beginner or seasoned professional, understanding candlesticks opens a new dimension of clarity in otherwise chaotic markets.
Each candlestick encapsulates a specific timeframe, from a one-minute tick to a monthly overview. The visual cues they provide allow for rapid, actionable insight.
Grasping this structure is the first step toward decoding how buyers and sellers battle for control during each session.
Candlesticks are not just shapes; they echo the hopes, doubts, and decisions of every trader. A long wick signals a failed break, while a slender body screams uncertainty.
Patterns such as the doji, hammer, and shooting star are visual manifestations of powerful high-probability reversal signals. They occur when one side of the market pauses or capitulates, hinting at an imminent change in direction. Interpreting these correctly can lead to more confident, timely entries and exits.
Candlestick patterns fall into two broad categories: single-candle formations and multi-candle configurations. Both can act as reversal or continuation indicators when placed in the right context.
Beyond these, multi-candle patterns like the Bullish Engulfing, Bearish Engulfing, Morning Star, and Three Black Crows provide deeper insights into trend strength and reversals.
Candlestick signals grow more trustworthy on longer timeframes. Daily and weekly charts filter out market noise, allowing patterns to emerge with high-probability reversal signals that backtests often confirm.
Statistical studies show that patterns like the Shooting Star deliver around a 59% success rate in predicting bearish reversals, while formations such as Three Black Crows can approach 78% reliability under ideal conditions. However, context is key—volume spikes, support and resistance levels, and broader market trends all shape the outcome.
Practical application of these patterns demands discipline, patience, and a blending of tools. Alone, a pattern might mislead; combined with other indicators, it forms a robust strategy.
Seasoned traders often maintain a candlestick cheat sheet, enabling swift recognition and response during live trading sessions.
No method is infallible. Candlestick patterns can generate false alarms in choppy markets or when liquidity dries up. To mitigate this, always seek confirmation through volume, trendlines, and momentum indicators.
Backtesting your setups on historical data and paper trading in real-time environments will sharpen your instincts, ensuring you only trade the most potent setups.
Candlestick patterns lie at the intersection of psychology, probability, and chart artistry. By mastering their nuances—from single-candle signals to complex multi-bar formations—you gain a powerful toolkit for navigating market uncertainty.
Every chart tells a story of buyers and sellers in conflict. With practice and patience, you too can learn to read these stories, turning cryptic candles into a compass for smarter, more confident trading decisions.
References


